获取网站或应用程序上最受欢迎的页面列表通常很有用,可以用于分析,也可以构建 UI 元素,向用户展示您最受欢迎的内容是什么。在过去,命中计数器可能会用于跟踪您最受欢迎的页面。
但是,在现代世界中,使用 Google Analytics API 要容易得多。由于 Google 最近将 Analytics 更新为“Google Analytics 4”,并且还更改了 Javascript API,我想我会写一篇关于我如何在 Fjolt 上完成此操作的指南。对于本教程,我将使用 Node.JS。
注意:这仅适用于新的 Google Analytics 4,并且*不*适用于以前版本的 Google Analytics。
谷歌分析 API#
如前所述,最近 Google 已将我们所有人升级到新版本的 Google Analytics,简称为“Google Analytics 4”。数据模型与旧版本的 Google Analytics 完全不同,Google 借此机会对其 API 进行了标准化,以使其与其他服务所使用的内容保持一致。
此 API 已记录在案,但它是实验性的,因此可能会更改。但是,我想这里使用的高级概念将保持不变,Google Analytics 本身的数据模型肯定会保持不变。
第 1 步:创建 Google 服务帐户#
许多来自非传统技术背景的程序员或开发人员往往一想到“服务帐户”就畏缩不前,但它本质上是一个无需人工即可登录服务为您执行操作的帐户。做一个:
如果您还没有,请转到 Google Developer Console 并创建一个新项目。
在左侧,单击“凭据”,然后单击创建凭据。选择“服务帐户”作为凭据类型。填写详细信息,然后单击完成。
现在回到您所在的位置,在“凭据”页面上,您应该会看到一个新的服务帐户。单击它,然后导航到键。在该页面中,单击“添加密钥”,然后创建一个 JSON 密钥。
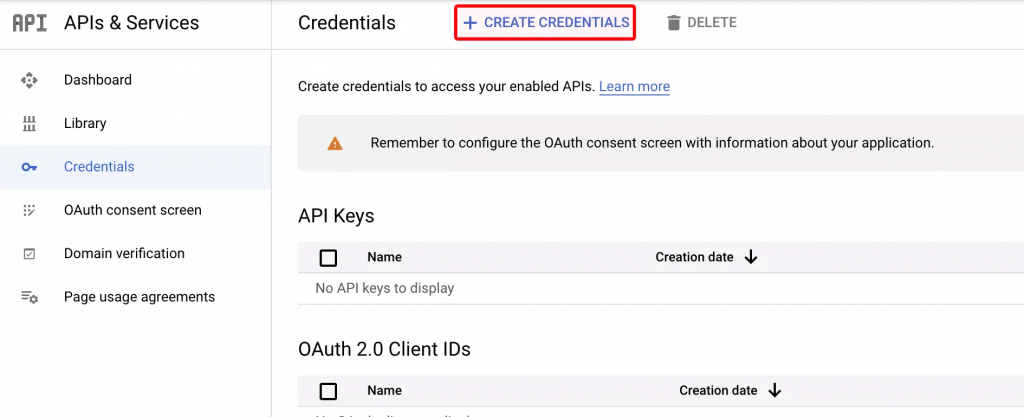
太好了,现在下载该密钥,并妥善保管。我们稍后会需要它。
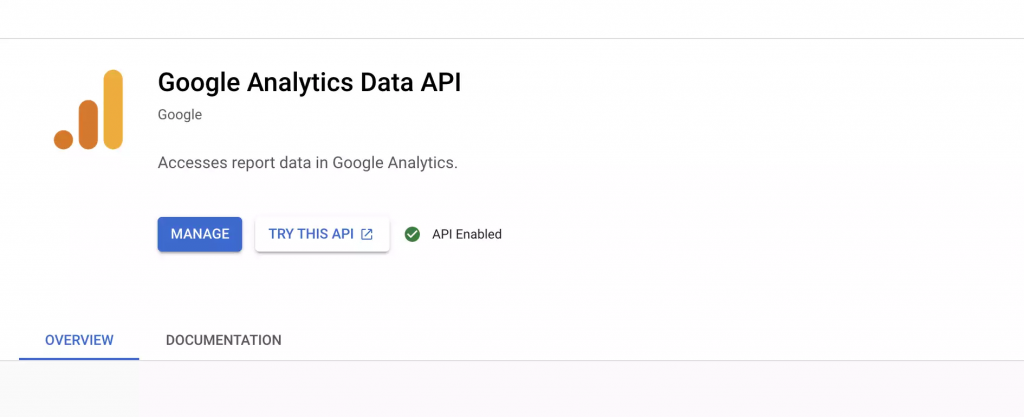
然后导航回项目主页,在顶部搜索栏中搜索“Google Analytics Data API”。为您的项目启用此服务。请注意,如果您使用的是旧版本的 Analytics,则需要使用不同版本的 API。请注意为 Google Analytics 4 选择正确的一个:
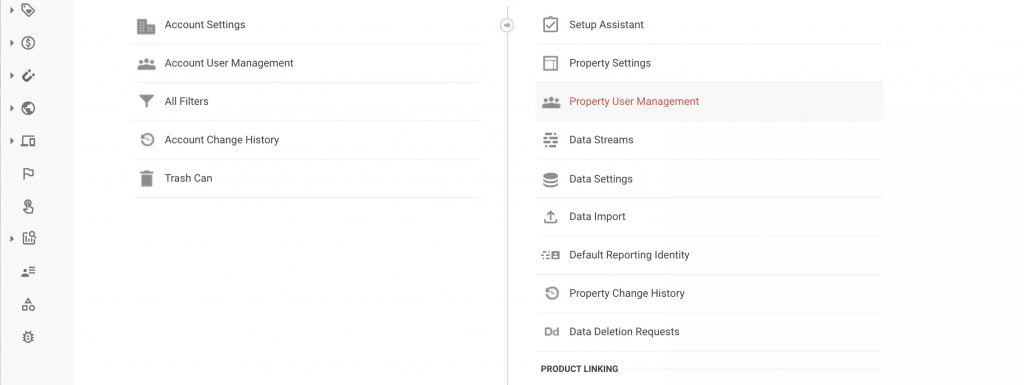
最后,在 Google Analytics 的管理部分将您的服务帐户添加到您的 Google Analytics Property。您可以通过单击“属性用户管理”来完成此操作,如下所示,单击蓝色加号,然后选择“添加用户”。
添加您的服务帐户电子邮件地址。您只需为其授予“读取和分析”访问权限。
第 2 步:链接到 API#
现在我们已经完成了内务管理,我们需要使用新的 Google Analytics beta 客户端。如前所述,有一个新的 API,可能会发生变化,但这不应该影响我们现在。确保安装正确的软件包:npm i @google-analytics/data
下面的“key.json”文件是指您将从 Google 服务帐户下载的密钥。
import { BetaAnalyticsDataClient } from '@google-analytics/data';
// Creates a client.

const analyticsDataClient = new BetaAnalyticsDataClient({
    keyFile: './key.json'
});
现在我们有了一个经过身份验证的 Analytics 对象,我们可以使用它来 ping Google Analytics 并检索数据。对于本教程,我将从我的个人博客中获取上个月最受欢迎的帖子。我写的所有博客文章都以“/article/”开头,因此我们可以轻松地分离出我们想要的文章。
第 3 步:获取分析数据#
首先,让我们获取最近 31 天的数据,并将其传递到分析报告对象中。有关详细信息,请参阅代码中的注释。请注意,您还需要将下面的 propertyId 更新为您的 Google Analytics(分析)媒体资源 ID。这可以在 Google Analytics 的“管理”部分的“属性设置”下找到。
let propertyId = 'ENTER YOUR PROPERTY ID HERE';
// Get the day 31 days ago
let today = new Date().getTime() - (60 * 60 * 24 * 31 * 1000);
// Get the day, month and year
let day = new Date(today).getDate();
let month = new Date(today).getMonth() + 1;
let year = new Date(today).getFullYear();
// Put it in Google's date format
let dayFormat = `${year}-${month}-${day}`;

const [response] = await analyticsDataClient.runReport({
    property: 'properties/' + propertyId,
    dateRanges: [
    {
        // Run from today to 31 days ago
        startDate: dayFormat,
        endDate: 'today',
    }
    ],
    dimensions: [
    {
        // Get the page path
        name: 'pagePathPlusQueryString',
    },
    {
        // And also get the page title
        name: 'pageTitle'
    }
    ],
    metrics: [
    {
        // And tell me how many active users there were for each of those
        name: 'activeUsers',
    },
    ],
});
当数据进来时,它将在“响应”变量中。我们希望对此进行一些更改,因为:
- 此数据将包含不是博客文章的 URL。
- 此数据还将包含从其他站点重定向的 URL,其中可能包含查询字符串和奇数字符。
因此,我们必须首先将搜索限制为仅以“/article/”开头的 URL,并删除在 URL 上发现的任何噪音。处理这些数据需要比我预期的更大的功能,但本质上是将原始 Analytics 数据放入一组按查看次数排序的“/article/”。我只想要前 7 名,但你可以随意调整。
您可能需要根据自己的需要稍微调整一下:
// newObj will contain the views, url and title for all of our pages. You may have to adjust this for your own needs.
let topRows = 7; // Number of items we want to return
let pageTitle = 'Fjolt - '; // The part off the front of the page title we want to remove, usually the domain name
let blogUrl = '/article/'; // The URLs we want to target.
let newObj = [];
response.rows.forEach(row => {
    // dimensionValues[0] contains 'pagePathPlusQueryString', and dimensionsValues[1] contains 'pageTitle'
    // We will remove and percentages from the end of URLs to clean them up. You may have to adjust this
    // If you make use of percentages normally in your URLs.
    if(typeof row.dimensionValues[0].value.split('%')[1] !== "undefined") {
        row.dimensionValues[0].value = row.dimensionValues[0].value.split('%')[0];
    }
    // We will remove the domain title from the start of the pageTitle from dimensionValues[1], to only give
    // us the page title. Again, you may have to change 'Fjolt -' to something else, or remove this entirely.
    if(typeof row.dimensionValues[1].value.split(pageTitle)[1] !== "undefined") {
        row.dimensionValues[1].value = row.dimensionValues[1].value.split(pageTitle)[1];
    }
    // We only want articles that have URLs starting with /article/
    if(typeof row.dimensionValues[0].value.split(blogUrl)[1] !== "undefined") {
        // This function will push an object with the url, views and title for any /article/ page.
        // If the article already exists in 'newObj', we will update it and add the views onto the old one
        // So we have one entry only for each article.
        if(typeof row.dimensionValues[0].value.split('?')[1] !== "undefined") {
            let findEl = newObj.find(el => el.url == row.dimensionValues[0].value.split('?')[0]);
            if(typeof findEl == "undefined") {
                newObj.push({
                    url: row.dimensionValues[0].value.split('?')[0],
                    views: row.metricValues[0].value,
                    title: row.dimensionValues[1].value
                });
            } else {
                findEl.views = `${parseFloat(findEl.views) + parseFloat(row.metricValues[0].value)}`;
            }
        } else {
            newObj.push({
                url: row.dimensionValues[0].value,
                views: row.metricValues[0].value,
                title: row.dimensionValues[1].value
            });
        }
    }
});
// We will order the articles by their view count using sort()
// This will give us a list of articles from highest to lowest view count.
newObj.sort((a,b) => (parseFloat(a.views) < parseFloat(b.views)) ? 1 : ((parseFloat(b.views) > parseFloat(a.views)) ? -1 : 0))
// I only want the top 7 articles, so I'm splicing that off the top.
newObj.splice(topRows, newObj.length);
第 4 步:创建用户界面#
下一步完全取决于您。根据这些数据,我想创建一个简单的 UI,它可以在我的页面上实时显示最流行的文章。
我的简单 UI 看起来有点像这样,它在 html 变量中返回,以便在您想要的地方使用。
let html = '<h2><i class="fas fa-fire-alt"></i> Recently Popular</h2><ol>';
newObj.forEach(function(item) {
    html += `<li><a href="${item.url}">${item.title}</a></li>`
});
html += '</ol>';

return html;
第 5 步:放松#
毕竟,我们有一个基于实时 Google Analytics 4 数据的简单最流行的小部件。最终代码可以在这里找到,并且可以在 Fjolt 的左侧查看演示。
